
Fraud Accounted For Nearly One-Third Of All Corporate Offenses Over 30 Years
By a Biometrica staffer
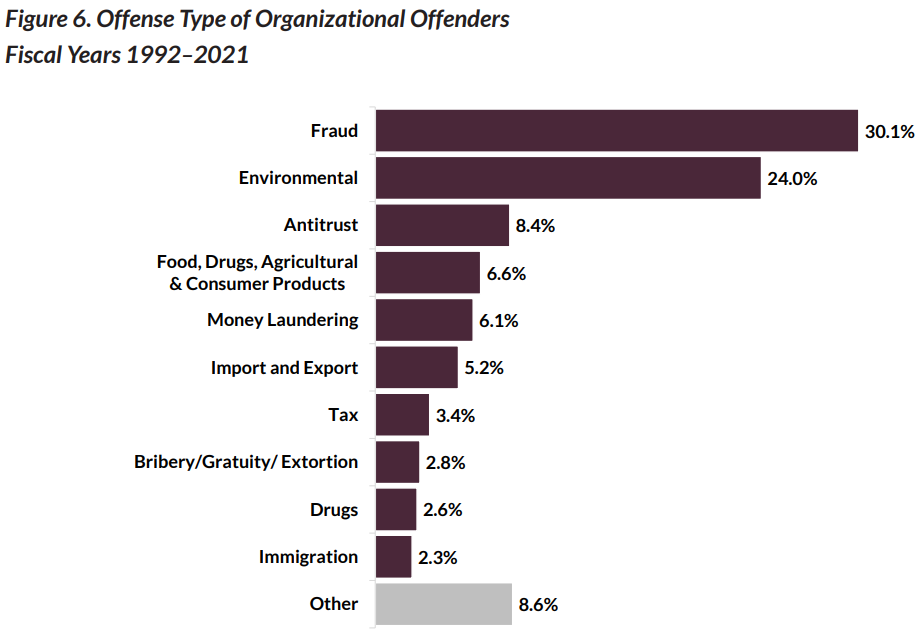
Fraud accounted for 30.1% of all organizational offenses during the near-30 year period between fiscal 1992 and 2021. Environmental offenses was the second largest offense category at 24%, according to a report published late last month by the United States Sentencing Commission (USSC).
Together, fraud and environmental offenses were the biggest types of misdeeds committed by organizations during the timeframe. Other common corporate criminal offenses types included: antitrust (at 8.4%), food and drug (6.6%), money laundering (6.1%), and import and export crimes (5.2%).
The USSC report captures broad strokes of how the corporate crime landscape has shifted over the last three decades. However, before we proceed further, it’s important to pause here to note that what the report shows should not be considered a “full measure” of corporate crime in the country.
Why? Criminal prosecutions resulting in a sentencing are only one of many methods by which an organization’s violations of the law can be addressed by the authorities. Therefore, USSC sentencing data cannot fully measure the prevalence of corporate crime.
Still, the data gives us a good sense of the state of corporate crime and trends in sentencing. In the rest of this piece, the first of a mini series, we will examine some key highlights of the report titled: The Organizational Sentencing Guidelines: Thirty Years Of Innovation And Influence.
By Offense Type
There were six major offense types that accounted for more than 80% of all organizational offenses between fiscal years 1992 and 2021. But, the USSC report says that there have been notable changes when it comes to the type of offense committed by corporates over the years.
During the first two years of data collection, for example, there were only a few organizational offenders sentenced and antitrust was the most common offense type. Then in 1994, the Commission observed a change in offense type: Fraud overtook antitrust as the most common offense.
Between fiscal years 1994 and 2010, fraud continued to remain the most common offense type. But from 2005, a new offense caught up with fraud: environmental offenses (it equaled fraud offenses in the year 2005). Although fraud still outnumbers environmental offenses on an overall basis over the past three decades, there have been some fiscal years over the past decade where it has been the other way around (i.e. with environmental offenses outnumbering fraud).
From fiscal year 2000, the Commission also started to collect data on the industry in which organizational offenders were doing business. Here’s what it discovered based on that:
- Between fiscal years 2000 and 2021, a majority of organizational offenders were doing business in the manufacturing industry (at 19.6%)
- Healthcare services (14%), retail trade (13.5%), transportation (11.9%) and services (11.1%) rounded out the top five industry categories of organizational offenders during that timeframe
- Around 6.2% of organizational offenders during the 21-year period belonged to the finance industry
Number Of Organizational Offenders
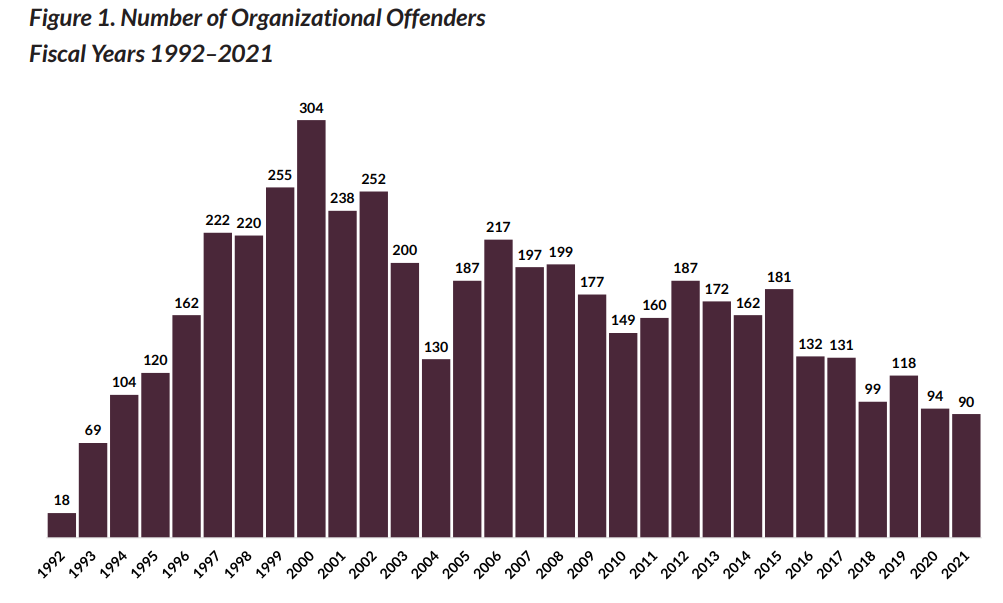
4,946 — That’s the number of organizational offenders sentenced in the 94 federal judicial districts during the 30-year period since promulgation of the organizational guidelines. In comparison, nearly two million individual federal offenders were sentenced within the same period.
Between fiscal years 1992 and 2000, the Commission noted a fairly steady increase in the number of organizational offenders, it says in the report. However, since 2000, the number of organizational offenders has gradually declined to below 100 in the most recent two fiscal years.
Also in fiscal year 2000, the Commission expanded its data collection to record whether an organization was a domestic or foreign organization. It discovered that a majority of the offenders (88.1%) were domestic organizations. The highest percentage of domestic organizational offenders was reported in fiscal year 2001 at 96.2%. Since then, though, the proportion of domestic to foreign organizational offenders has been treading down.
By Ownership Structure & Size
Data collected by the Commission based on ownership structures of offenders can be divided into five broad organization categories:
- Private
- Public
- Non-profit
- Governmental
- Other
An overwhelming majority of organizational offenders fall under the private category (at 92.2%). That is followed by public organizations (4.8%), other organizations (1.6%), non-profit (0.8%) and government organizations (0.6%).
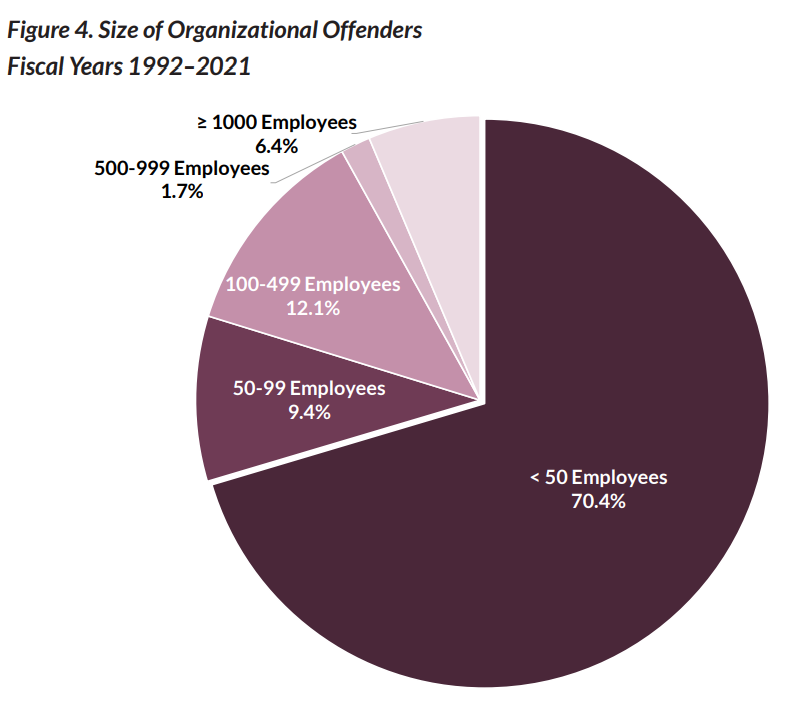
Another important factor to note is that a majority of organizational offenders who were sentenced are smaller companies with fewer than 50 employees (at 70.4%). Only 10% of organizations with over 500 employees were sentenced for organizational offenses during the three decade timeframe.
Financial Status Of Offenders
Criminal prosecution and sentencing of a company may impact its financial status, the USSC report says. A criminal conviction could drive away existing or potential customer base, and put the company’s ability to survive at risk. Sentences also typically include monetary sanctions, which could put additional stress on an already vulnerable organization.
Even so, a majority of organizations (64.5%) sentenced during the 30-year period were solvent and operational at the time of sentencing. About 30% were either defunct (17.6%) or in financial stress (13%) at the time of sentencing.
In the next part of this mini series, we will continue to look at findings from the USSC report on organizational offenses, focusing on individual charges, prior instances of misconduct, and sentencing outcomes.