
School Shootings With Casualties Spiked In 2020-21: Report
By a Biometrica staffer
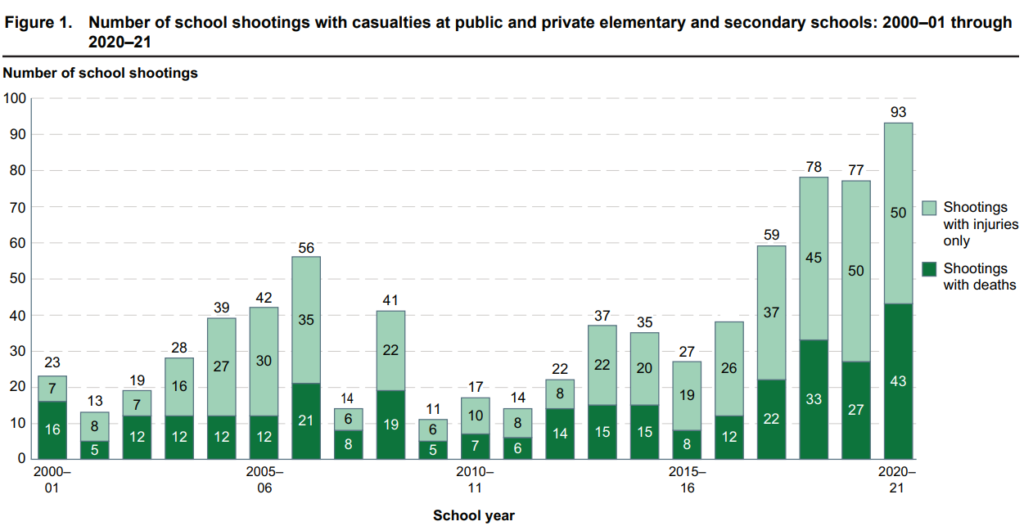
There were 93 school shootings with casualties at public and private elementary and secondary schools in 2020–21— the highest number since 2000–01, according to a new joint report published by the Bureau of Justice Statistics (BJS) and the National Center for Education Statistics (NCES), Institute of Education Sciences (IES), in the Department of Education. Those include shootings that happened on school property during the peak of the Covid-19 pandemic when remote learning was the norm. However, from a broader perspective, the Report on Indicators of School Crime and Safety: 2021 finds that several crime and safety issues have become less prevalent at elementary and secondary schools throughout the last decade.
For instance, between 2009 and 2020, the rate of nonfatal criminal victimization (including theft and violent victimization) decreased for students ages 12–18, from 51 to 11 victimizations per 1,000 students, the report finds. The report provides official estimates of school crime and safety from a variety of data sources, including national surveys of students, teachers, principals, and post-secondary institutions. In the rest of this piece, we’ll delve into some key findings from the report. We will explore findings from the report on incidents/discipline problems, gangs and hate-related speech, fights, weapons and illegal substances in a separate piece.
Violent Deaths & School Shootings
The report says violent deaths and school shootings are still rare events, although, undoubtedly tragic ones that have far-reaching effects on the school population and the surrounding community. It adds that:
- There were a total of 39 school-associated violent deaths in the country in the 2018–19 school year, based on the most recent NCES School-Associated Violent Death Surveillance System (SAVD-SS) data. That includes 29 homicides and 10 suicides. Of the 39 school-associated violent deaths, 10 homicides and 3 suicides were of school-age youth (ages 5–18).
- Between 2000–01 and 2020–21, the number of school shootings with casualties per year at public and private elementary and secondary schools ranged from 11 to 93. The 93 school shootings in 2020-21, which we mentioned at the beginning of this piece, includes 43 school shootings with deaths and 50 school shootings with injuries only.
- In addition, there were 53 reported school shootings with no casualties in 2020-21. During the year, 59 elementary schools and 57 high schools had shootings (including those with and without casualties). An additional 21 middle or junior high schools and 8 schools of other types also had school shootings.
- 2020-21 was the first year since data collection began in which fewer than half of schools that had shootings were high schools.
Criminal Victimization
As we mentioned earlier in the piece, school shootings aside, other metrics suggest there may be a downward trend in terms of overall crime and safety issues across schools in the U.S. Take nonfatal criminal victimization, which includes theft and violent victimization (including rape, sexual assault, robbery, aggravated assault, and simple assault).
- During year one of the Covid-19 pandemic (2020), students aged 12–18 experienced 285,400 victimizations at school and 380,900 victimizations away from school.
- That translates to a rate of 11 victimizations per 1,000 students at school and a rate of 15 victimizations per 1,000 students away from school.
- The total victimization rate at school first decreased from 51 to 30 victimizations per 1,000 students between 2009 and 2019. From 2019 to 2020, the total victimization rate at school continued to decline to 11 victimizations per 1,000 students in 2020 — an annual decrease of over 60%.
- The total victimization rate away from school also decreased; from 33 to 20 victimizations per 1,000 students between 2009 and 2019. The number for 2020 (i.e. 15 victimizations per 1,000 students) was not statistically different from the rate in 2019, per the report, citing data from the National Crime Victimization Survey (NCVS)
Bullying Victimization
When it comes to studies of school safety, it’s also important to examine bullying victimization. Per the report, research shows that students who are bullied are more likely to experience depression and anxiety, have more health complaints, and skip or drop out of school. “The involvement of young bullying victims in recent suicides and school shootings has also heightened concerns regarding the public health implications of bullying (Hornor 2018),” the report adds. Here are a few other key statistics about bullying victimization that the report highlights:
- During the school year in 2019, about 22% of students ages 12–18 reported being bullied at school, according to data from the School Crime Supplement (SCS), the report says. That compares with 28% of students in the same age group who reported being bullied at school in 2008.
- But, reports of being bullied varied based on student and school characteristics in 2019. For example, a higher percentage of female students reported being bullied at school during the school year than male students (i.e. 25% vs 19%).
- Race played a role too; higher percentages were reported by students of Two or more races (37%) than of White students (25%), Black students (22%) or Asian students (13%) in 2019.
- A higher percentage of 6-8th graders reported being bullied at school during the 2019 school year when compared with 9-10th and 12th graders. Similarly, a higher percentage of students enrolled at schools in rural areas reported being bullied than those in other locales.
- About 16% of students in grades 9-12 reported being electronically bullied during the 2019 school year, the report says, citing data from the Youth Risk Behavior Surveillance System (YRBSS).
- According to the YRBSS data, the percentage of students who reported being electronically bullied was higher for gay, lesbian, or bisexual students, than for students who were not sure about their sexual identity, while both percentages were higher than the percentage for heterosexual students.
The next piece in this two-part series will explore highlights from the report on incidents/discipline problems, gangs and hate-related speech, fights, weapons and illegal substances.